The DeGen Bible to Financial Freedom - Vol.26
The decline of stablecoin market cap is remarkable in the last 3 weeks. New stuffs to explore in the BTC ecosystem. US CPI, Shanghai upgrade, Chicago CME interest change, notably FED's March meeting minutes will be released this week.
Week 3 Apr - 10 Apr 2023
Boring markets test the faithful - Mars Captain
🧠 Observations
- The only remarkable trend in the last three weeks is the decline of stablecoin market cap. But with such a relatively small total crypto market cap. Captain thinks people just swapped their stables (like Binance & USDC hodlers) to BTC mostly. We don't see any hype on Ethereum, despite the imminent Shanghai Upgrade. If I might refresh our subscribers' memory, post-LUNA crash summer 2022, the market pattern was highly identical to the current one, difference this time is the BTC emphasis.
- So, there is a lot new stuff to explore in the BTC ecosystem. Captain likes Stacks, but don't forget Interlay on Polkadot, despite there is a lot of disappointment and inflated developer activities in the Kusama realm. In a way, we might see all the DeFi, NFT, Metaverse and whatever initiated in Ethereum a prelude/experiment of what's gonna happen in BTC.
- A Turbulent week is starting, US CPI, Ethereum Shanghai upgrade, Chicago CME interest change, notably FED's March meeting minutes will be released. Not an easy week post-Easter.
- But wait, don't forget the dragon in the East is hosting (another) week of Web3 events in Hong Kong after a month of events with more exhibitors than participants.🥱🥱🥱 (Seriously, you fomo into that 💩?)
💵 Stablecoin & Market Landscape
- Stablecoin market share remains high in reference to the total crypto market capitalization. 10.8% of stablecoin (132.9B) on 1.23T crypto market.
Reminder: Mid-NOV 2021, this percentage was around 4ish% with a 3T total MC. Now we are at 10ish% with a 1ishT total MC.
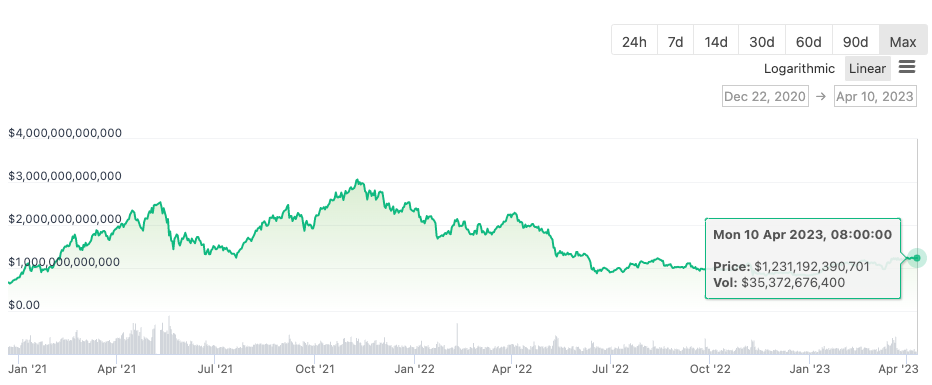
- Now at 1.23 T. Still hanging around on the 1T level. Going steady.
Reminder, June and Nov 2022 witnessed a bottom of 800ish B MC vis-a-vis the market’s top in NOV 2021 at 3T.
Infographics

- Oil has penetrated every corner of the modern industrial world. Looking at oil price is as interesting as looking at fear index.

- Actually, the bigger picture is the declining overall volume on NFT trades. It is the end of a generation, jpegs evaluated at millions of dollars.

- Not gonna play my smartass here. I quote BTC magazine's original statement, "It’s worth pointing out the historical correlation between ISM PMI and SPX year-over-year performance (another leading indicator of economic recession). Historically, traditional markets have bottomed after the ISM PMI has bottomed out."

- There is a lot of going-ons in the BTC ecosystem these days. This SEAN times volume covers a lot of BTC stuff and they all look very interesting and somehow you can see a similar pattern of the ETH-led NFT summer in 2021.
🔢 Index
Bitcoin Fear and Greed Index is 62 ~ Greed
— Bitcoin Fear and Greed Index (@BitcoinFear) April 10, 2023
Current price: $28,341 pic.twitter.com/EOi2OO5pIQ
- It's been stagnant on the 60 level for 3ish weeks. As per other market data points. If it doesn't break 🔼, it will soon ⏬.
Daily #CBBI status update:
— CBBI - ColinTalksCrypto Bitcoin Bull Run Index (@CBBI_daily) April 9, 2023
https://t.co/YpDBHLshNn
𝐂𝐎𝐍𝐅𝐈𝐃𝐄𝐍𝐂𝐄 𝐒𝐂𝐎𝐑𝐄: 2️⃣5️⃣
🗓 Apr 9th, 2023
The price of #Bitcoin is $27,914 pic.twitter.com/1C44Npqeiy
- Again, another stagnant data point. Wen breaks?
📰 Current affairs
Starfish Finance:



BTC


ETH
Let's wait for the Shanghai upgrade in two days.
Layer 1s/ Major DeFi


Nakamoto Portfolio Theory
— Alpha Zeta (@alphaazeta) April 5, 2023
-----------------------------
Schrödinger's Coin Model 🐈
Valuing Bitcoin as a Store of Value
How #Bitcoin will demonetize other assets and why it's significantly undervalued by 13x today
This is quite the thread. Hang tight🚀▶️@SwanBitcoin @samcallah pic.twitter.com/Qaq42Pijgv
Ticketmaster just nailed the proof of concept for NFTs.
— Origins NFT (@OriginsNFT) April 2, 2023
Sales Force recently announced they were doubling down on web3 integration.
But few are talking about how closely these two behemoths are entwined and what this means for NFT adoption.@S4mmyEth reports.🧵(1/13) pic.twitter.com/1LxZwSUY5h
Did you fade Ordinals this whole time?
— Jameson Mah 🧙🏻♂️ (@JamesonMah) April 6, 2023
And now that they're about to cross 1M inscriptions (yes, actually) you're scrambling to get up to speed?
Don't worry, I gotchu.
Behold – the definitive Ordinals megathread 🧵
1/57 pic.twitter.com/X0qkePyaLD
There’s a new protocol in town: Bitcoin Stamps 📮
— Trust Machines (@trustmachinesco) April 4, 2023
They’re a new way of storing images directly on Bitcoin, but they’re very different from Ordinals.
Here’s why their transactions look like this 👇
🧵… pic.twitter.com/F3GLDxiV6L
What every investor should know before buying crypto governance tokens in the open market💹
— Alex (@thiccythot_) April 5, 2023
A🧵on the mechanics🛠️of token market making (MM) deals and potential for abuse🕵️♀️
Bonus: personal rant on why we need to demand more disclosures📜from projects for the space to grow
1/ pic.twitter.com/XsWLoKRMA5
NFTs


Macro econ/ Regulations



Research reports/videos (DYOR)


